
Forty trillion, and the decade it was supposed to shrink
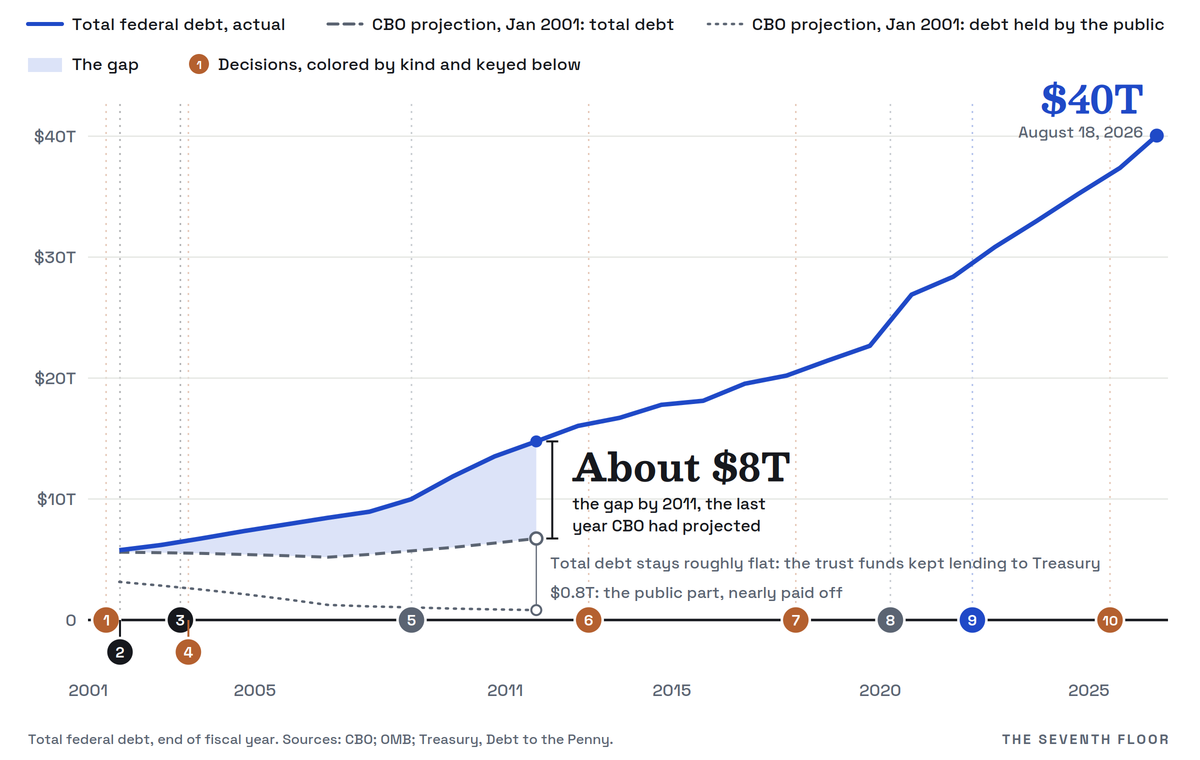
“…the point at which publicly held debt is effectively eliminated.” (Alan Greenspan, January 2001) || CBO projected public debt nearly paid off by 2011. What arrived: three rounds of tax cuts, each later extended, two wars, two shocks, and an interest bill nobody voted for. || Edited by Kaz Rubel
Tax cuts
- 1Tax cuts, round oneEGTRRA, June 2001
- 4Tax cuts, round twoJGTRRA, May 2003
- 6Cuts made permanentDecember 2010 extension, January 2013 deal
- 7Tax cuts, round threeTCJA, December 2017
- 10Cuts extendedJuly 2025
Wars
- 2AfghanistanOctober 2001
- 3IraqMarch 2003
Economic shocks
- 5Crash and rescueTARP, October 2008; ARRA, February 2009
- 8PandemicCARES Act, March 2020; American Rescue Plan, March 2021
The bill arrives
- 9Borrowing gets expensiveFederal Reserve rate increases begin, March 2022
Chart: The Seventh Floor. Actual debt, 2001 to 2025: OMB, as published in the Economic Report of the President. August 18, 2026: Treasury, Debt to the Penny. Projections: CBO, The Budget and Economic Outlook: Fiscal Years 2002 to 2011 (January 2001), Tables 1-4 and 1-6. Total debt includes what the Treasury owes its own trust funds. Fiscal years end September 30.
“The emerging key fiscal policy need is to address the implications of maintaining surpluses beyond the point at which publicly held debt is effectively eliminated.” This was Alan Greenspan, chairman of the Federal Reserve, in January 2001. So what happened? How has America’s tab, as of August 18, 2026, passed $40 trillion? The answer, in short, is three rounds of tax cuts and their extensions, two wars, two economic shocks, and above all, interest payments which were the result of policy implemented years earlier.
One important difference is the difference between total and public debt. Public debt includes only the outside debt the government owes to bondholders from past borrowing. This bucket made up about $32.27 trillion of the total on August 18. The other bucket is what the Treasury owes its own trust funds: about $7.78 trillion, the largest share of it held by Social Security. Together, the two buckets came to $40.05 trillion.
The Congressional Budget Office projected public debt would fall from about $3.15 trillion in 2001 to $818 billion in 2011, or from 30.5 percent to 4.8 percent of GDP. Instead, the U.S. government accumulated $6.14 trillion in deficits from 2002 to 2011. Part of this increased deficit spending was due to tax cuts. President Bush implemented tax cuts which reduced revenue and increased the debt in both 2001 and 2003. President Obama then extended these cuts in 2010 and made them permanent in 2013 for individuals earning less than $400,000 a year and married couples earning less than $450,000. Finally, President Trump, in 2017, heavily reduced the corporate and individual tax rates, and then extended these cuts in 2025. On top of these major cuts, trillions of dollars were spent on the wars in Afghanistan and Iraq and trillions more were spent to restart the economy both during the Great Recession in 2008, when the government had to bail out banks due to risky mortgage lending, and during the COVID-19 crisis in 2020, when Congress passed the CARES Act to protect small businesses and the unemployed.
However, the largest cost of all is interest, and it is only growing. America does not have enough income to pay for Social Security, Medicare, the military, and outstanding interest payments. As such, America has to borrow money from other institutions with a guarantee that the government will pay the money back with an amount added on. This added cost is known as interest. In fiscal year 2024, net interest on the debt came to $949 billion, more than the $826 billion the Defense Department spent on its military programs. CBO projects that in 2026, America will pay over $1 trillion in interest. From 2009 to 2021, interest rates sat near zero for most of the stretch and never rose above 2.5 percent, and most forecasts assumed they would stay low. This allowed leaders to take out debt without fear of rising interest costs. However, due to aggressive inflation following the COVID-19 pandemic, the Fed raised interest rates from near zero to about 5 percent in 16 months. The cost of carrying the debt jumped with them. This cost has largely gone unseen, and it could force Congress to choose between raising taxes or cutting services.
In 2001, experts were worried about what America would spend its financial surplus on. Twenty-five years later, the question has become how to prevent the debt from indefinitely eclipsing growth. This crisis was caused not by one president, war, or policy, but by the series of tradeoffs which have forced America to consider difficult and potentially painful decisions.
Documents
The primary record this piece was built on. The reader gets what we got, and can go check us.
The record the argument rests on
- Congressional Budget Office, The Budget and Economic Outlook: Fiscal Years 2002 to 2011, January 2001.
- Congressional Budget Office, Changes in CBO’s Baseline Projections Since January 2001, June 7, 2012.
- Congressional Budget Office, The Budget and Economic Outlook: Fiscal Years 2011 to 2021, January 2011.
- Congressional Budget Office, H.R. 1, the Tax Cuts and Jobs Act, cost estimate, November 13, 2017.
- Congressional Budget Office, Additional Information About the Updated Budget and Economic Outlook: 2021 to 2031, July 2021.
- Congressional Budget Office, Monthly Budget Review: Summary for Fiscal Year 2024, November 8, 2024.
- Congressional Budget Office, An Update to the Budget and Economic Outlook: 2024 to 2034, June 2024.
- Congressional Budget Office, The Budget and Economic Outlook: 2026 to 2036, February 2026.
- Congressional Research Service, An Overview of the Tax Provisions in the American Taxpayer Relief Act of 2012, R42894, February 4, 2013.
- Board of Governors of the Federal Reserve System, FOMC statement, March 16, 2022; Open Market Operations, rate history.
- U.S. Department of the Treasury, About TARP; About the CARES Act.
- Costs of War Project, Watson Institute, Brown University, U.S. Federal Budget.
- U.S. Department of the Treasury, Bureau of the Fiscal Service, Debt to the Penny, reading of August 18, 2026.
The institution’s own statement of what it intended
- Alan Greenspan, Outlook for the Federal Budget and Implications for Fiscal Policy, testimony before the Senate Committee on the Budget, January 25, 2001.